Source-Aware Urban Traffic Digital Twin
A simulated traffic incident rebuilt as a 3D OpenUSD / Omniverse workflow with OSM, SUMO, synthetic sensor outputs, and transparent signal-response artifacts.
From traffic incident to inspectable decision loop
Cities rarely lack maps, models, dashboards, or sensor feeds. The harder problem is that these pieces often sit apart from one another. A map shows where the city is, a traffic model shows motion, an incident note describes what happened, a camera frame gives partial context, and a policy report explains a response. When those artifacts are separated, the decision process becomes difficult to inspect after the fact.
I built the case around a practical gap I kept seeing in digital-twin examples: the map, simulation, sensor frame, incident state, and response report often explain different parts of the story. The interesting work is connecting them tightly enough that the reasoning path can be reviewed afterward.
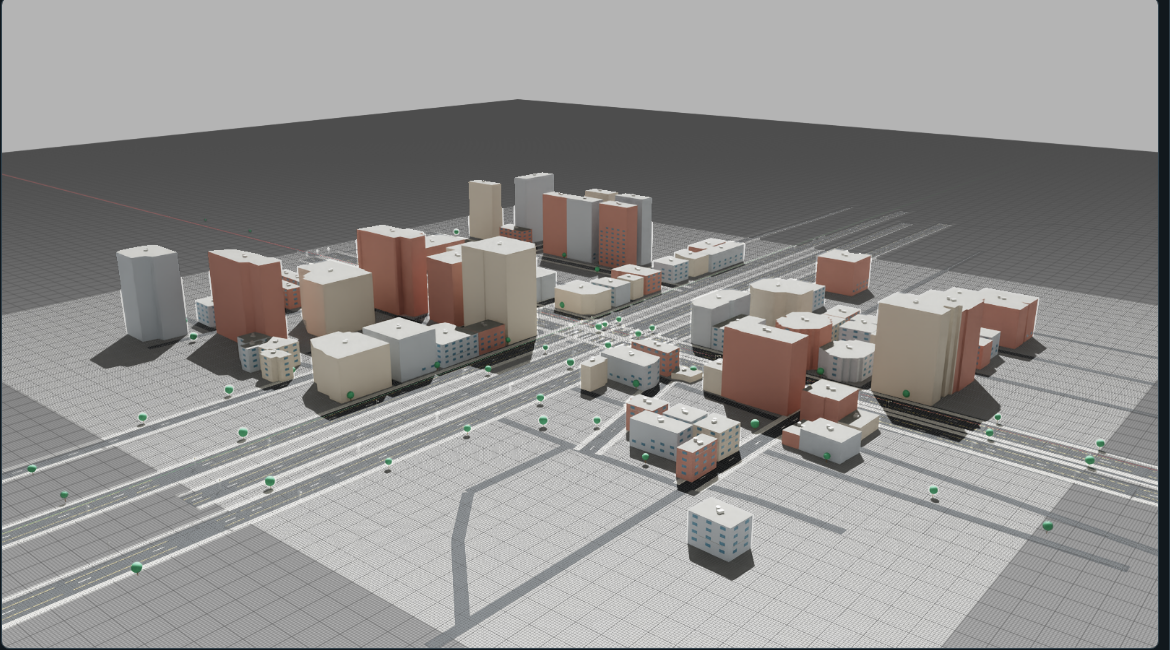
Primary visual. The project begins as a clean OpenUSD / Omniverse city scene. The scene acts as a spatial container for source data, traffic state, incident outputs, and response artifacts.
Source-to-world alignment
The prototype starts with the traffic source before the polished scene. The SUMO state stays readable in 2D first, then the same coordinates and actor state are projected into world context. I used that order because it preserves the difference between source data and visualization.

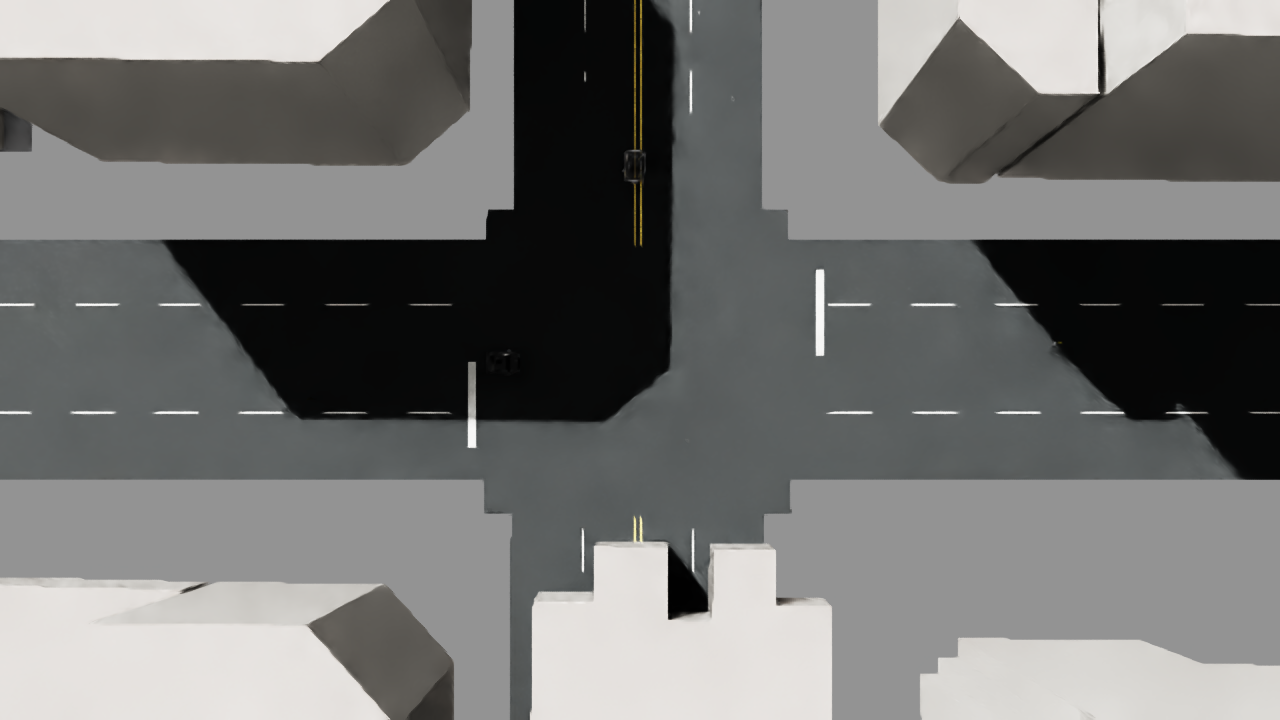
2D traffic source. The SUMO FCD export preserves lane polylines, actor positions, speed state, and source boundary as the inspectable traffic source behind the scene.

World-context layer. The same WGS84 traffic tracks can enter the key-gated Google 3D preview and also serve as alignment material for OpenUSD / Omniverse replay layers.
OSM boundary, SUMO routes, and FCD tracks.
SUMO local coordinates become WGS84 and local metric scene space.
Satellite / Google context checks whether roads and replay layers land in plausible positions.
Traffic state enters OpenUSD / Omniverse scene layers as a shared coordinate frame for event and policy artifacts.
The world-context poster is a public-safe artifact. The interactive version lives at 3D world browser experiment and requires a local Google Maps API key for the photorealistic city layer; the public page exposes the overlay and export logic only.
Problem definition
The work is built around the chain between observation and response. When a map, traffic model, incident cue, sensor frame, and policy report remain disconnected, the scene can look convincing while the reasoning path stays opaque.

Map, traffic simulation, incident outputs, synthetic sensors, and response-policy reports exist as separate outputs. They can be shown, but the viewer has to mentally reconstruct how one led to another.

Source data, traffic state, event metadata, OpenUSD layers, policy comparison, and KPI outputs are organized as one inspectable chain that can be replayed and audited.
The before / after visual sets up the reader’s mental model: the same artifacts move from separate outputs into a traceable decision-output chain.
Decision loop as project structure
The decision loop becomes the project structure. Each step between a traffic cue and a response produces a concrete file, view, or scene layer.
The Source layer comes before the loop: geographic boundary, route network, traffic demand, incident definition, and synthetic-data limits. After that, the workflow moves through observed traffic state, event metadata, a simple signal-response comparison, and exported response artifacts.
- Input. OSM boundary, SUMO routes, and incident JSON.
- Artifact. source registry and scope notes.
- Purpose. define what data enters the scene.
- Input. traffic state, actor positions, phase labels.
- Artifact. exported JSON, frames, and sensor captures.
- Purpose. make scene state replayable.
- Input. event time, severity, affected zone.
- Artifact. incident card and OpenUSD scene layers.
- Purpose. turn visual events into inspectable state.
- Input. fixed timing and queue-aware baseline.
- Artifact. KPI table and delay / throughput tradeoff.
- Purpose. give the response a reviewable reason.
- Input. chosen response and action layer.
- Artifact. report, OpenUSD layer, and exported data.
- Purpose. leave outputs that can be audited later.
Walkthrough: material from source to response
1. Anchoring the scene to a real place
The base scene starts from a reproducible geographic boundary and moves through map reference, satellite alignment, generated mesh, and OpenUSD scene assembly. The goal is to make the spatial origin of the twin visible before the incident layer is introduced.
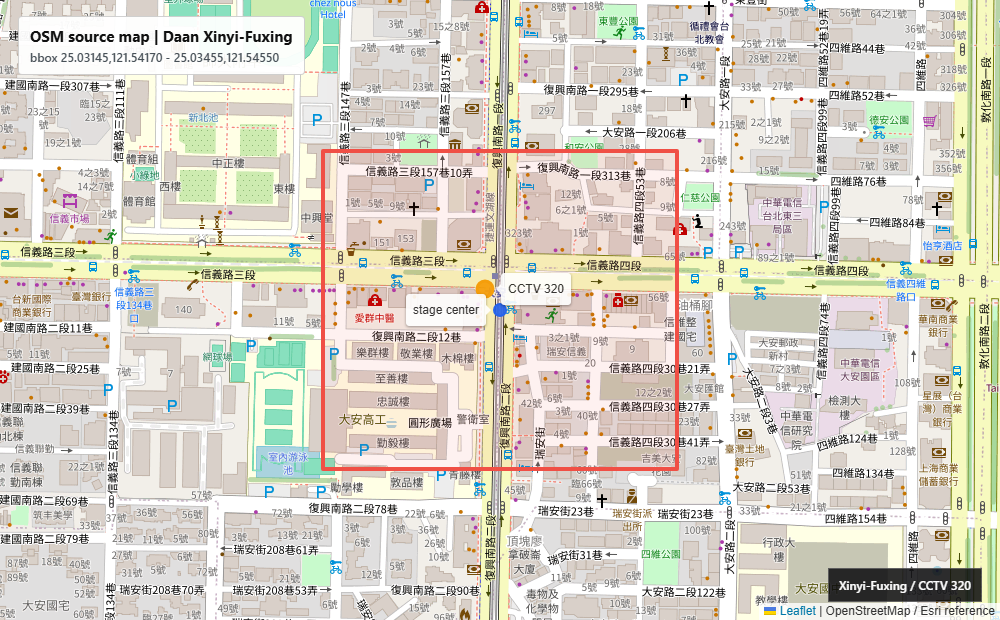
Source boundary. OpenStreetMap / Overpass defines the Daan intersection study area.
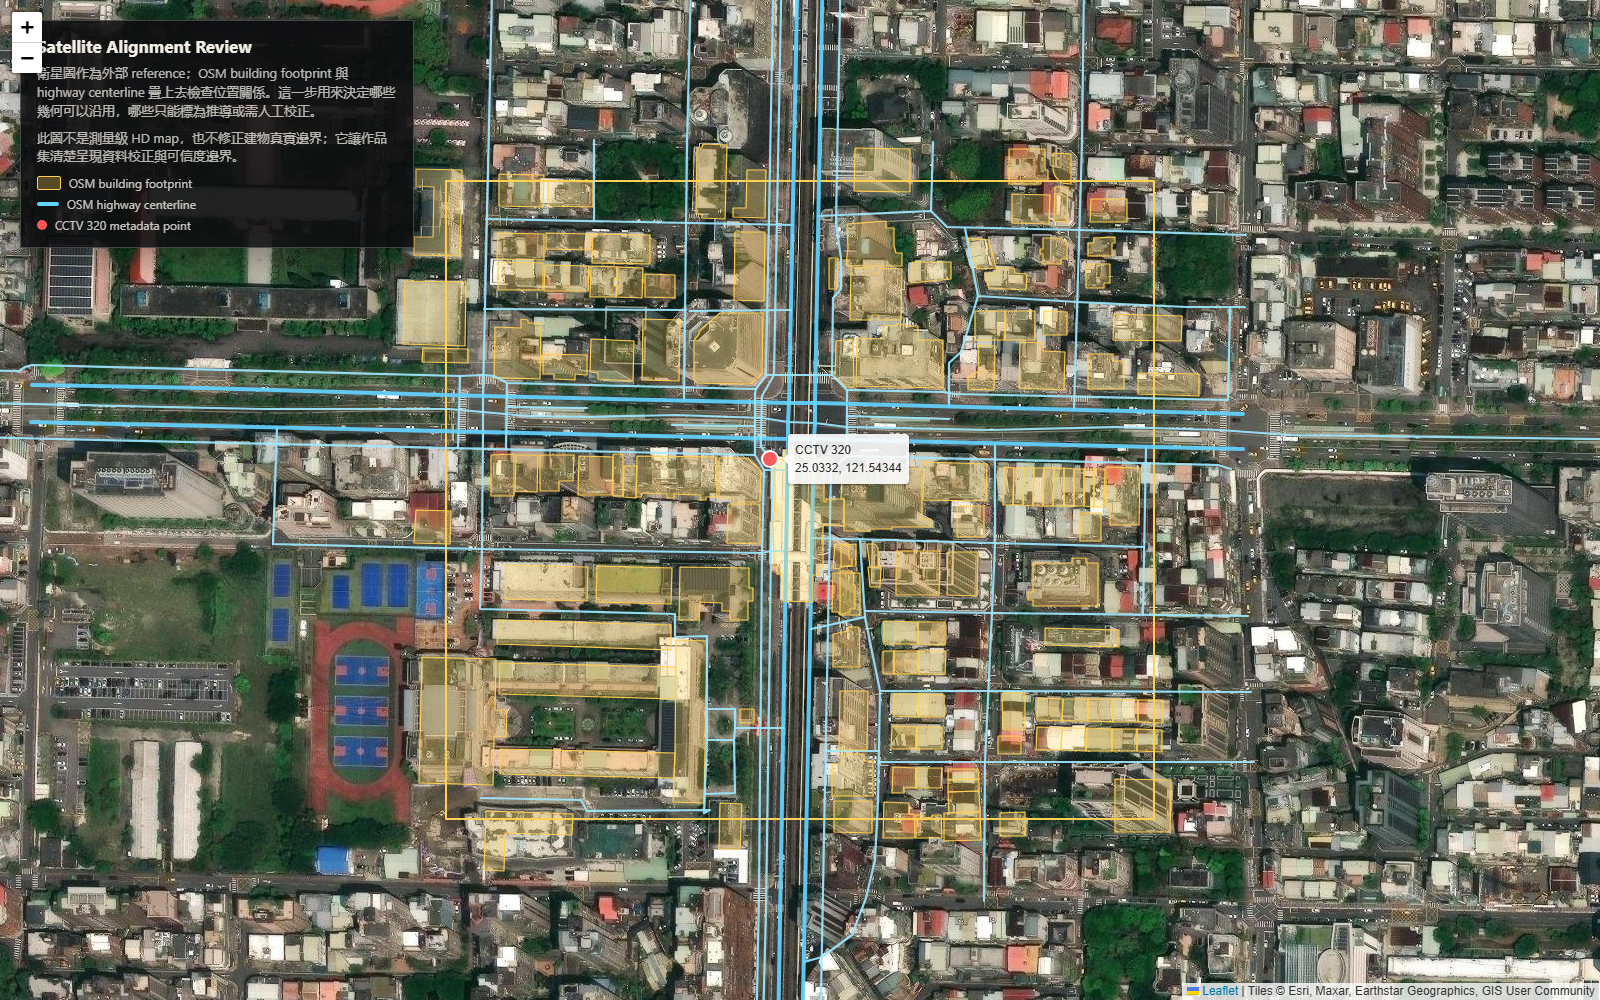
Alignment check. Satellite reference checks where the OSM-derived road model sits in the real city context.

Mesh generation. A vector redraw keeps the OSM2World road mesh, building footprints, and study boundary legible at portfolio scale.

Scene assembly. The low-resolution top-down capture is replaced by a readable layer diagram showing geometry, traffic, incident, sensor, and action layers.

Omniverse review. Scene inspection inside the simulation / OpenUSD environment.
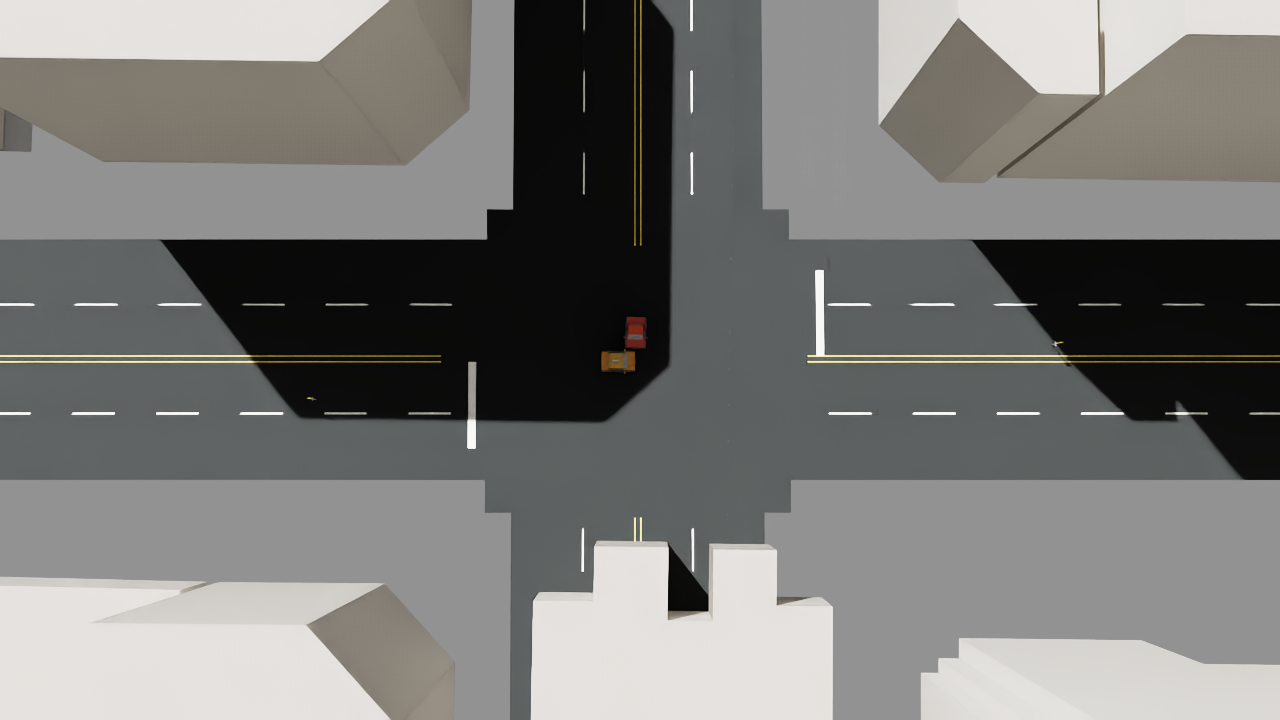
Clean scene layer. Visual review without the event overlay, useful for checking the base environment.
Implementation note: Anchoring OpenStreetMap to OpenUSD, the coordinate transform you can actually run twice.
2. Traffic before and during the incident
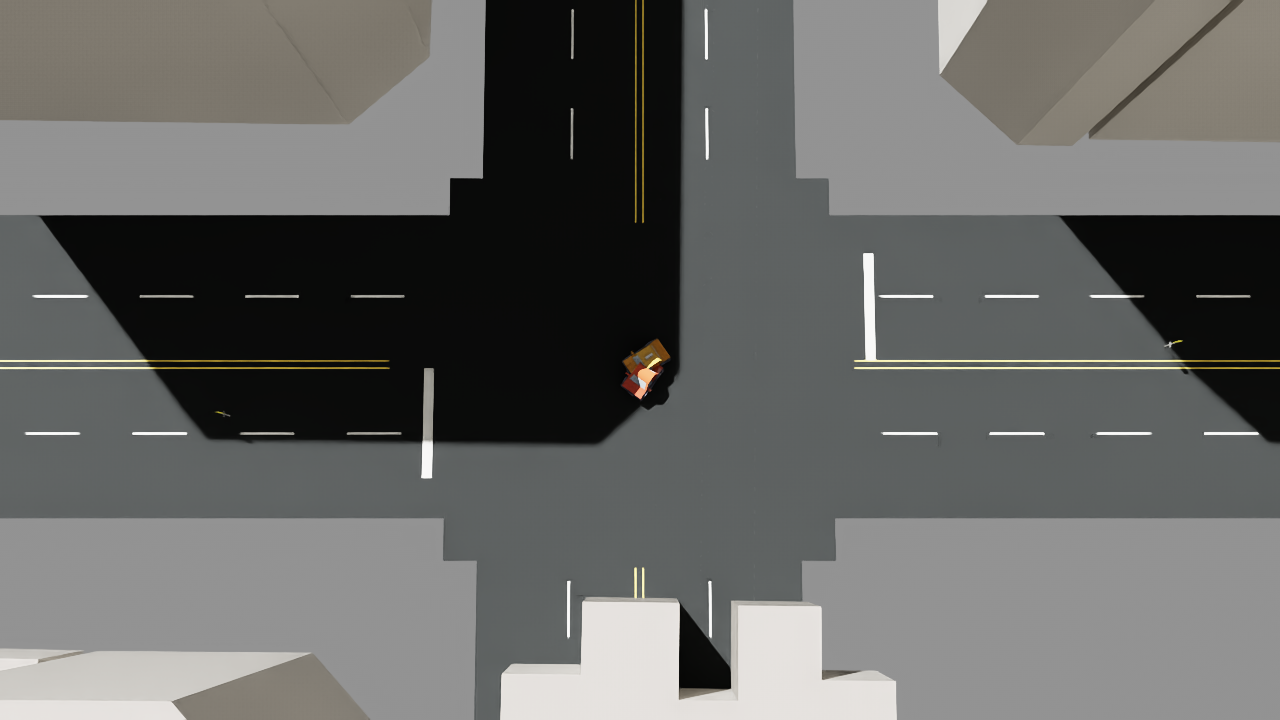
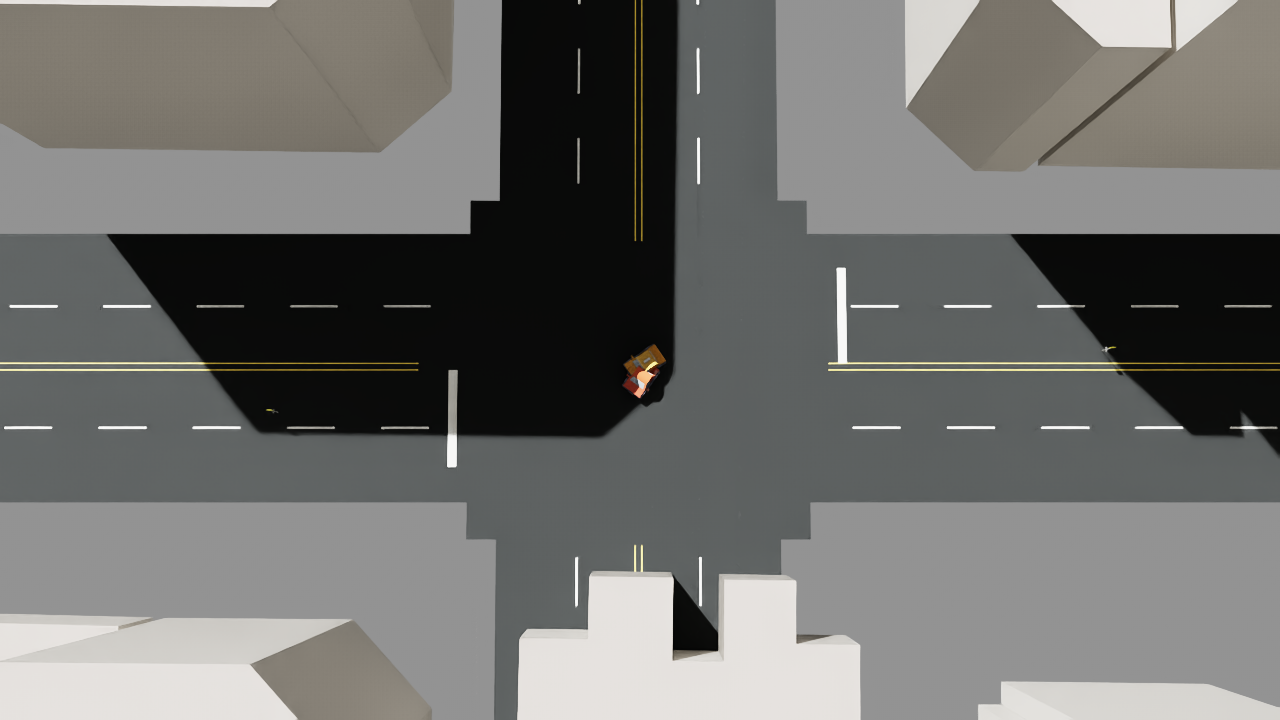
The next layer is time. Traffic motion, phase labels, and replayable incident outputs turn the base model into a scenario that can be inspected frame by frame.
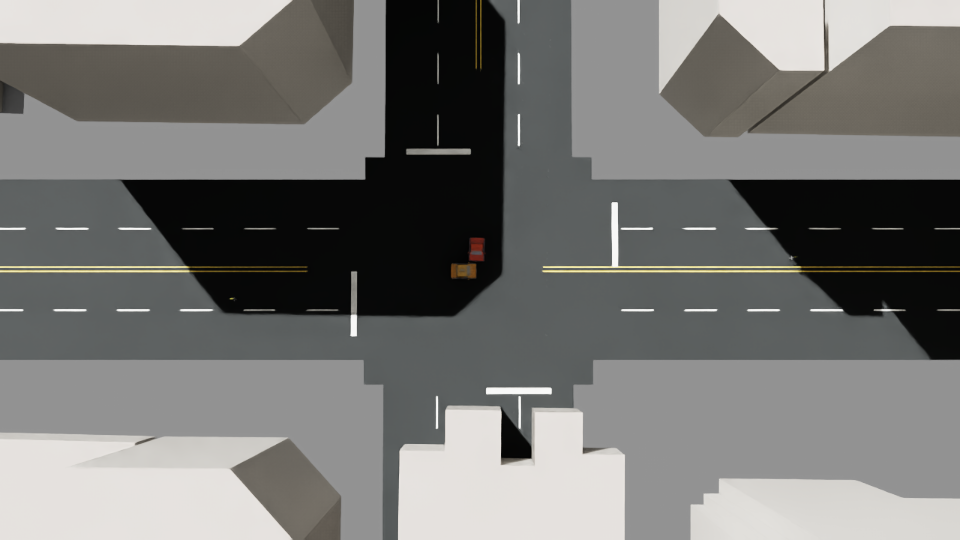
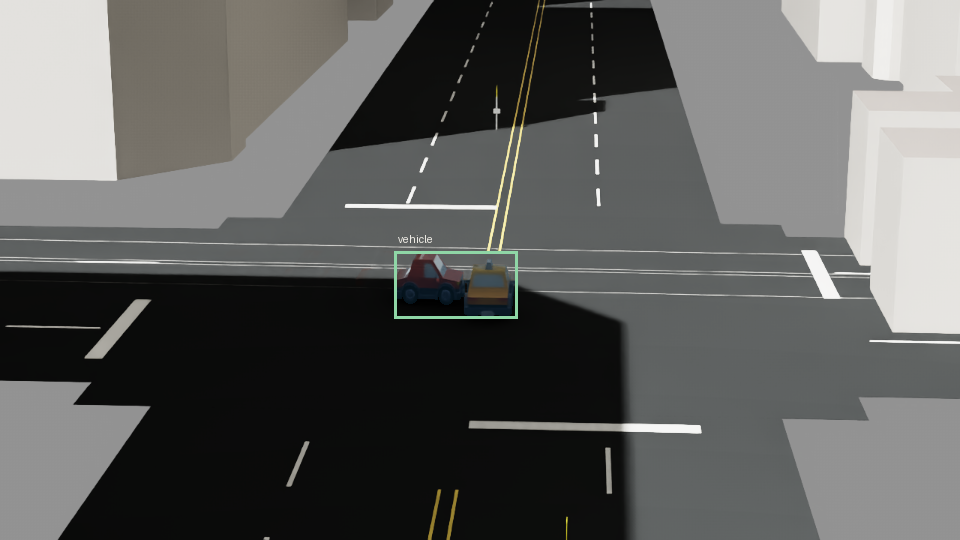
SUMO traffic replay. Synthetic FCD traffic state drives the scenario timeline.
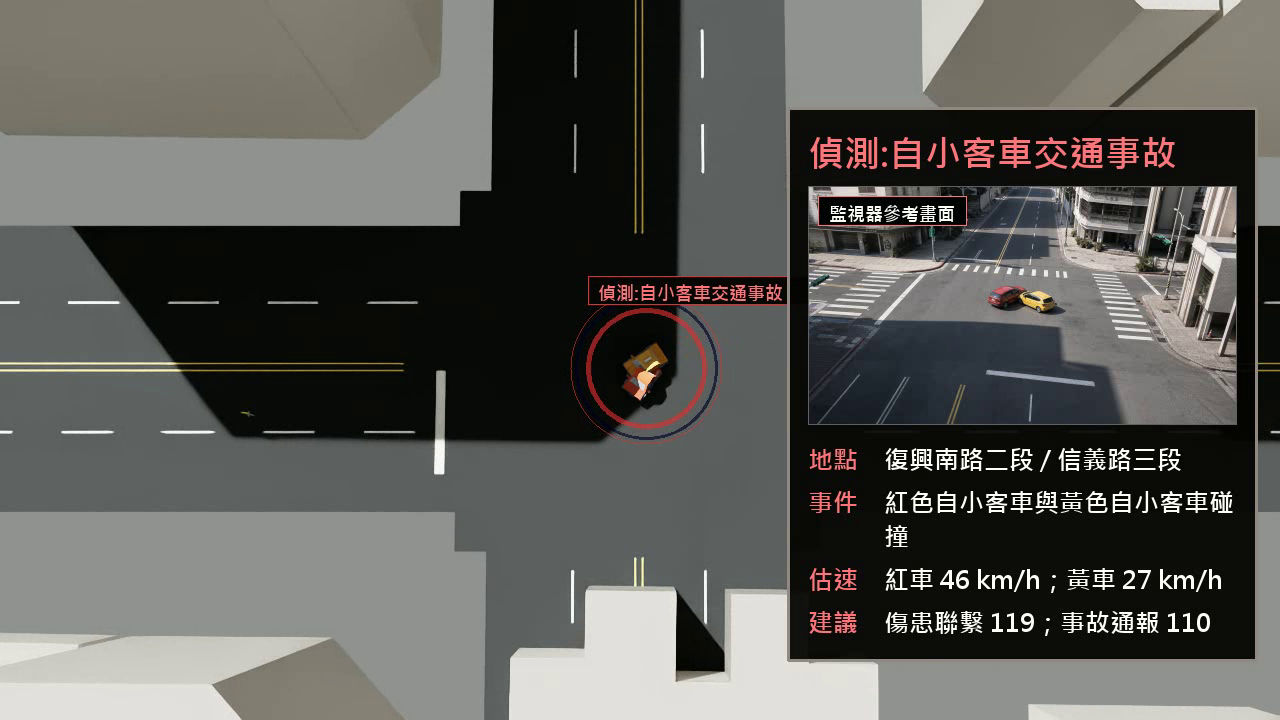
Incident replay. Synthetic CCTV-style incident outputs aligned with event metadata.
3. Event state inside the scene
The incident becomes structured metadata: phase, event time, source, severity, affected zone, and response status. Those fields turn the visual scene into something a response workflow can reference.

Operator event card. Event metadata appears as an incident card beside the render.

Phase timeline. The visual scenario is tied to named event phases and timestamps.
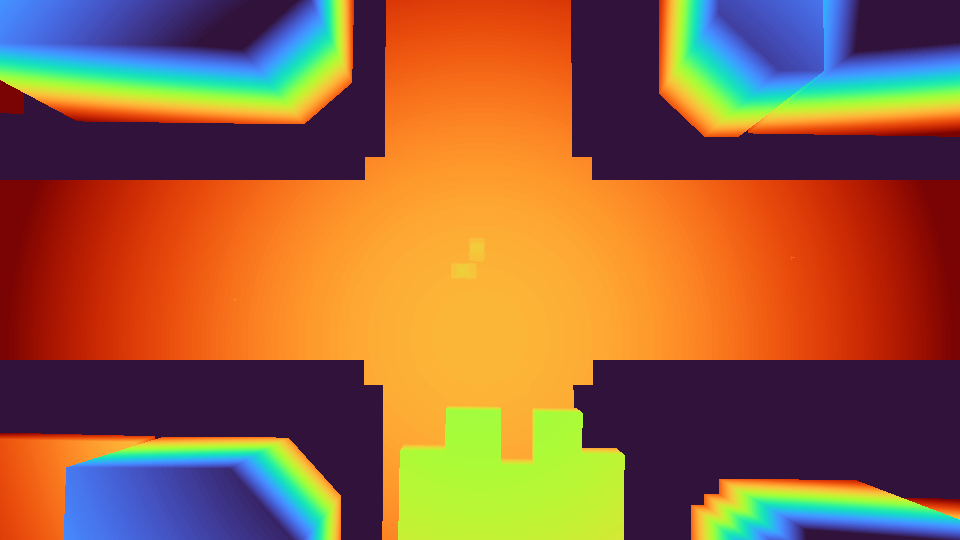
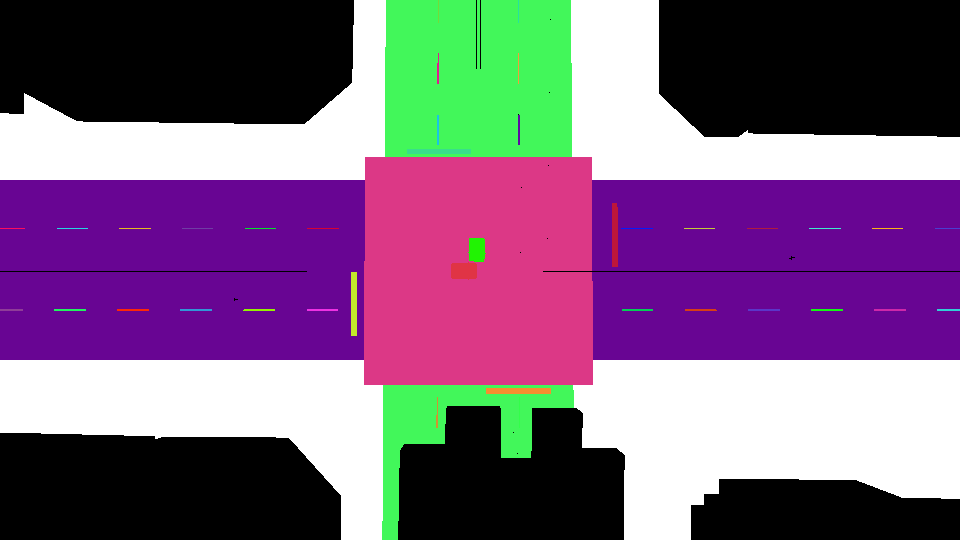
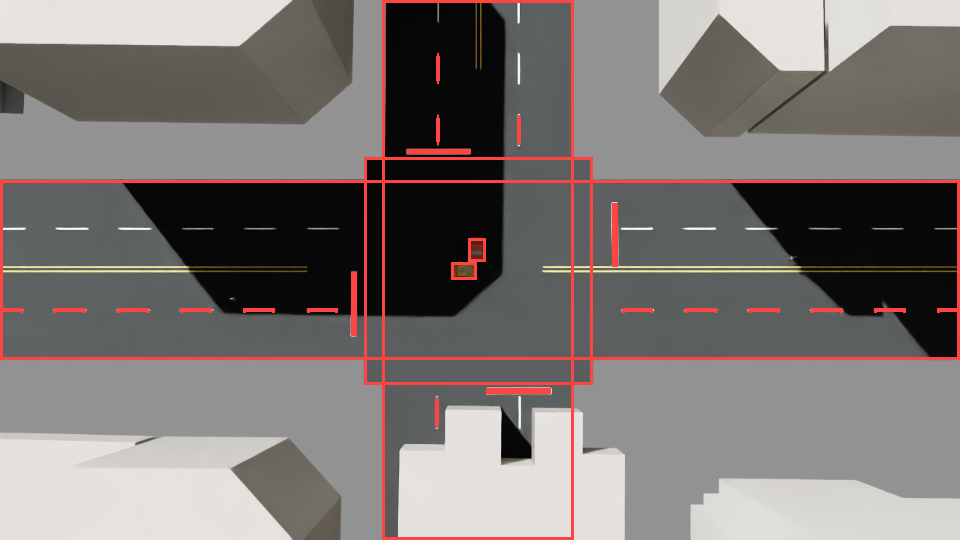
4. Sensor outputs from an instrumented intersection
Omniverse is used here for generated sensor views as well as visualization. The same incident frame exports aligned RGB, depth, semantic masks, instance masks, bounding boxes, and derived detection targets. Dense dataset previews are kept in an expandable section so the main page can stay focused on the incident-response walkthrough.
Open sensor-output images
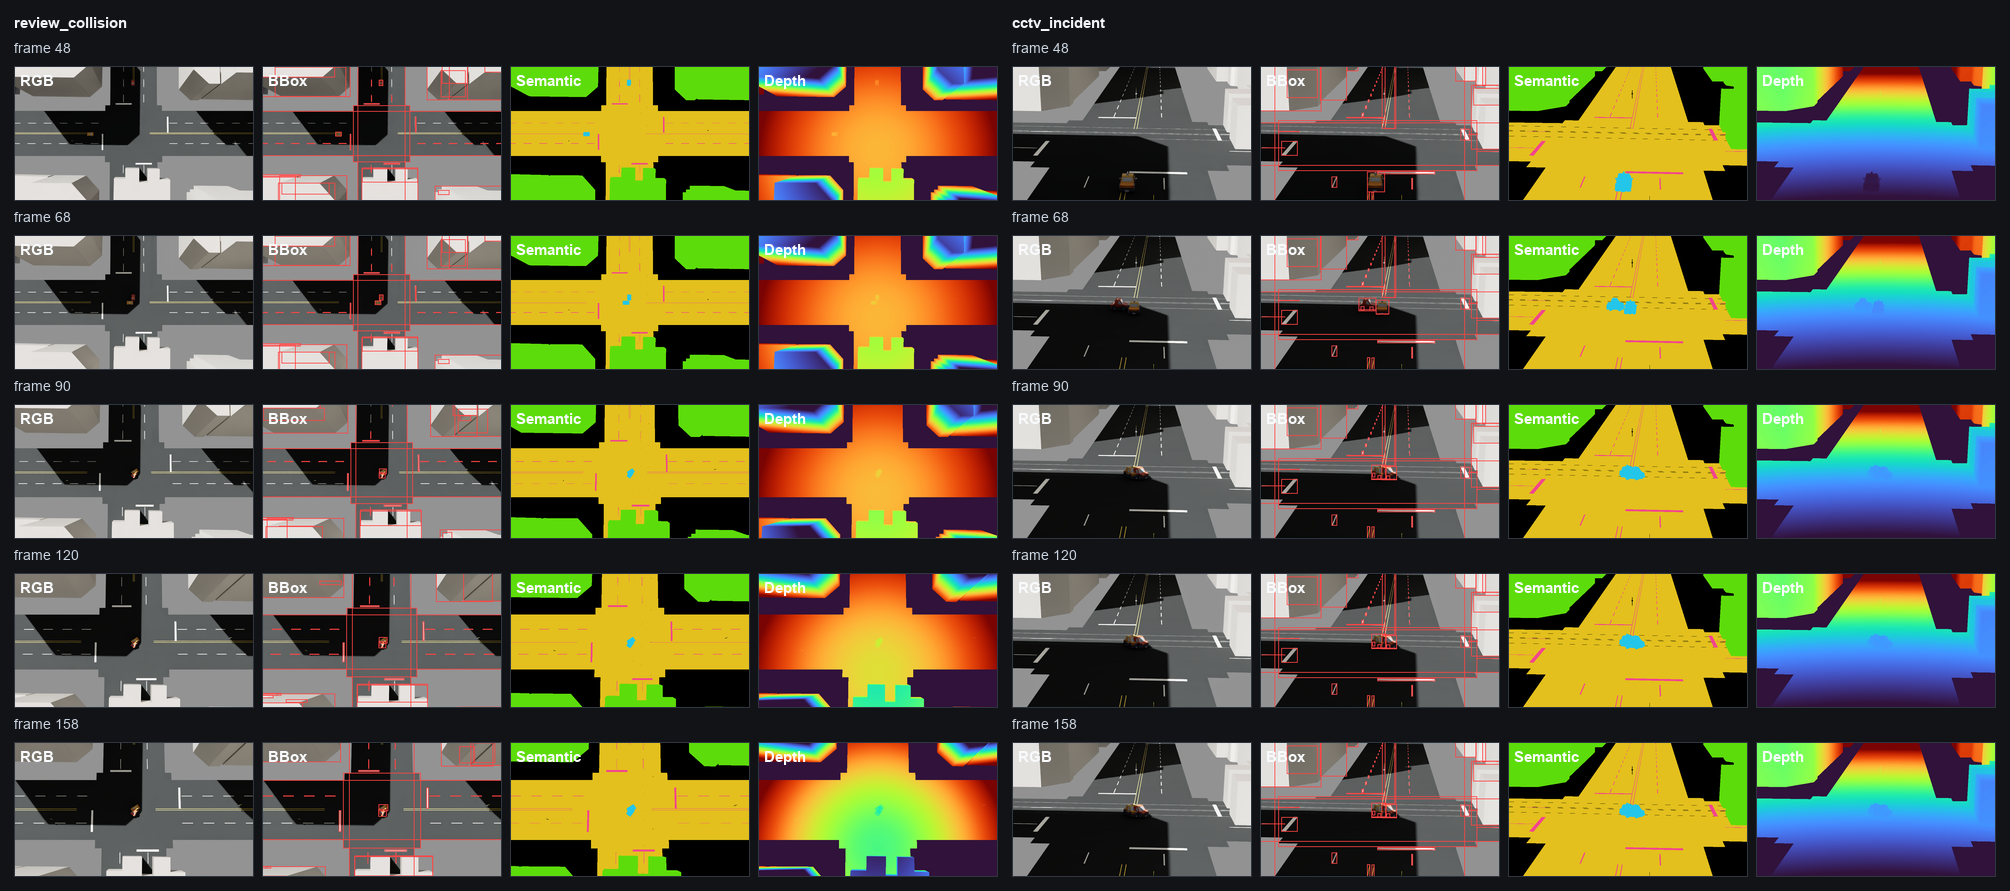
Synthetic sensor contact sheet. One incident scenario exported into multiple aligned training / validation channels.

One generated run: 222 incident-event samples, 111 frames across 2 cameras, 2,220 ground-truth files checked, 259 vehicle instances derived from semantic masks, with phase labels carried from the event layer.
5. Response choice and remaining outputs
The signal-response layer stays simple on purpose: fixed timing versus a queue-aware baseline. In this scenario, the queue-aware version lowers delay while throughput remains a tradeoff. That result is enough to make the response choice discussable without turning the page into a full traffic-control optimization project.
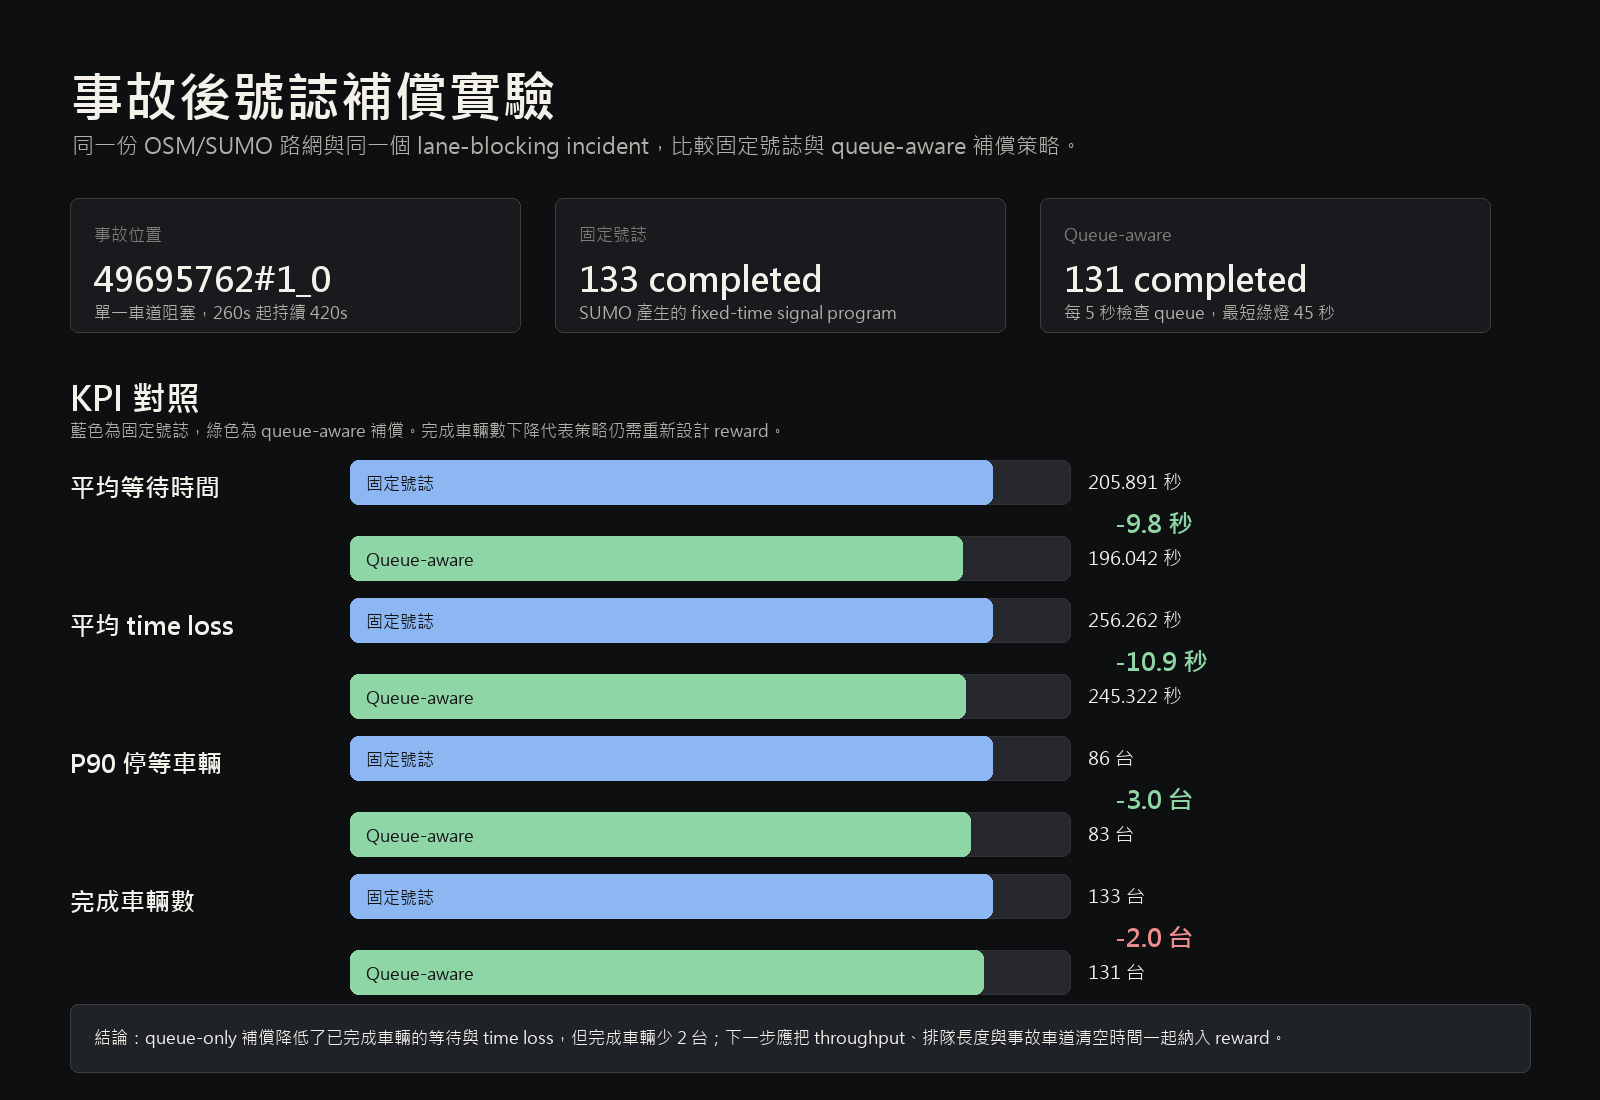
Response comparison. Queue-aware control reduced delay metrics in this run while throughput remained a tradeoff.
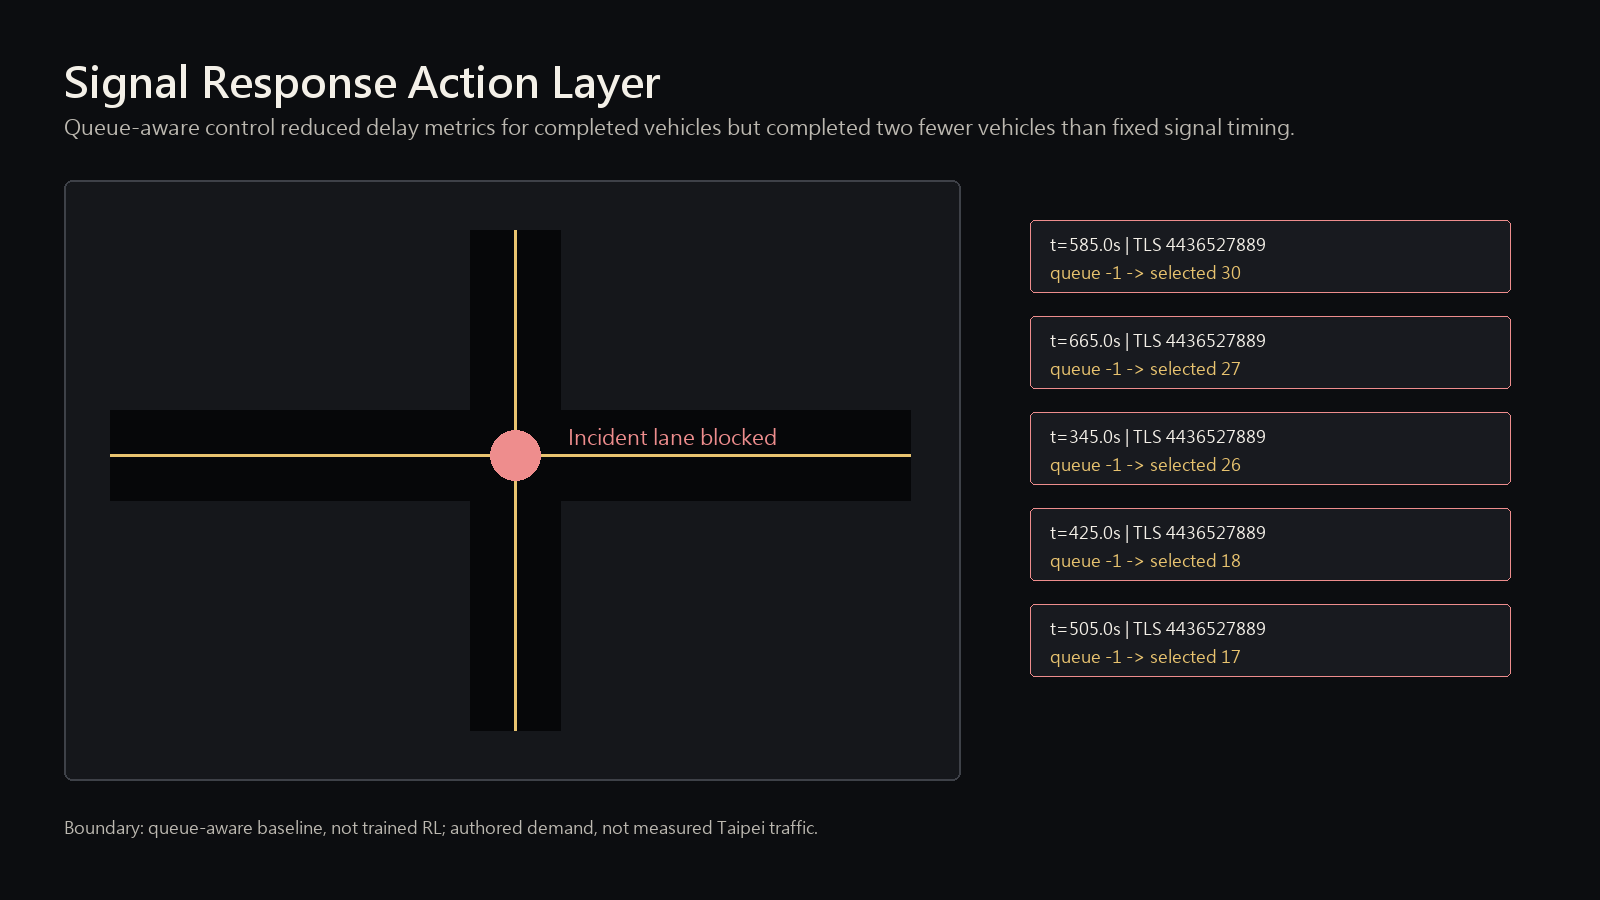
Action layer. Signal response is represented as data alongside the rendered scene.
Scope
The current prototype covers the inspectable workflow: source-data pipeline, scene layers, generated sensor outputs, and response artifacts. Live-city deployment, real CCTV integration, and RL policy training sit outside this version.
- OSM / SUMO source-data pipeline
- OpenUSD source, observe, and action layers
- Google 3D preview prototype
- validation reports and exported JSON artifacts
- synthetic sensor-output generation and checks
- traffic actors are SUMO-generated
- incident outputs are synthetic
- CCTV-style views are generated simulator outputs
- the signal response is a transparent baseline comparison
- reinforcement-learning policy training is a next-stage extension
Direction
This project connects my spatial-design background with the engineering work I want to keep building: digital twins and real-time 3D systems where physical context, simulation state, and operational outputs stay close enough to inspect, replay, and improve.
In an industrial digital-twin context, this smart-city case pairs with a companion project focused on CAD-to-SimReady warehouse composition: Smart Warehouse CAD-to-SimReady Digital Twin.
Artifacts
These are the generated artifacts behind the page: