Source-Aware 城市交通數位孿生
把一個模擬交通事故整理成 3D OpenUSD / Omniverse workflow,串接 OSM、SUMO、合成感測器輸出與透明的號誌 response artifacts。
從交通事故到可檢查的決策迴路
城市通常不缺地圖、模型、儀表板或感測器資料。比較困難的是,這些東西常常彼此分散。地圖告訴我們城市在哪裡,交通模型告訴我們車流怎麼動,事故紀錄描述發生了什麼,相機畫面提供局部狀態,而 policy report 解釋為什麼採取某種回應。當這些 artifact 彼此分離時,事後就很難檢查決策是如何形成的。
這個 case 來自我在 digital twin examples 裡常看到的斷裂:map、simulation、sensor frame、incident state 和 response report 各自說明一部分,卻很難回頭看 decision path 是怎麼形成的。我把這頁做成 source data、scene state、event notes、response choice 和 exported outputs 之間的連接。
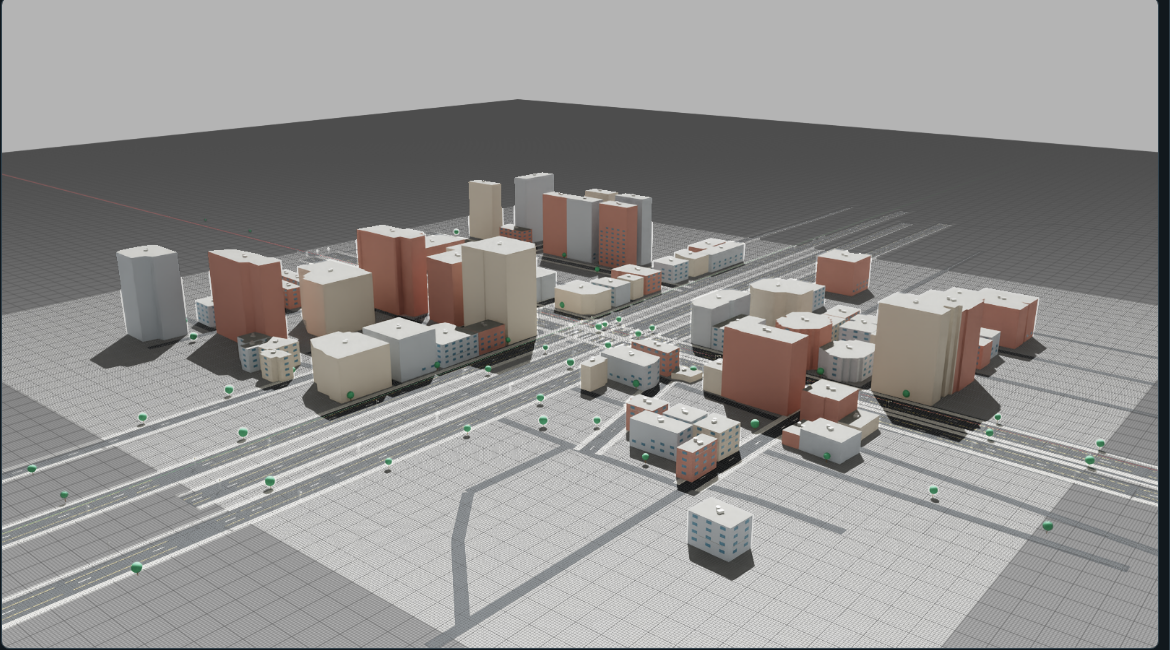
主視覺。 專案從乾淨的 OpenUSD / Omniverse 城市場景開始。這個場景是用來承載 source data、traffic state、incident outputs 和 response artifacts 的空間容器。
Source 到 world context 的對齊
這個 prototype 先從 traffic source 開始,再進入 polished scene。SUMO state 先在 2D 裡保持可讀,再把同一組 coordinates 與 actor state 投射到 world context。這個順序讓 source data 和 visualization 的責任分得比較清楚。

2D traffic source. SUMO FCD export 保留 lane polylines、actor positions、speed state 與 source boundary,作為場景背後可以被檢查的交通來源。

World-context layer. 同一批 WGS84 traffic tracks 可以進到 key-gated Google 3D preview,也可以作為 OpenUSD / Omniverse replay layer 的對齊依據。
OSM boundary、SUMO routes、FCD tracks。
SUMO local coordinates 轉成 WGS84 與 local metric scene space。
用 satellite / Google context 檢查道路與 replay 是否落在合理位置。
把 traffic state 放入 OpenUSD / Omniverse scene layers,作為事件與 policy 的共同座標系。
這份 world-context poster 是 public-safe artifact。真正的互動版在 3D world browser experiment,需要本機 Google Maps API key 才會載入 photorealistic city layer;公開頁面只展示 overlay 與 export 邏輯。
問題定義
本案例聚焦在 observation 到 response 之間的資料鏈。當地圖、交通狀態、事故 cue、sensor frame 與 policy report 各自分散時,畫面可以看起來有說服力,但決策如何形成仍然不透明。

地圖、交通模擬、事故輸出、合成感測器與 response-policy report 各自存在。它們可以被展示,但觀看者必須自己腦補這些東西如何互相連接。

Source data、traffic state、event metadata、OpenUSD layers、policy comparison 與 KPI outputs 被整理成一條可檢查、可 replay、可 audit 的 chain。
這組 before / after visual 先建立讀者理解方式:同一批 artifact 從分散輸出,被整理成可追溯的 decision-output chain。
把決策迴路當成 project structure
這裡的決策迴路直接變成 project structure。從 traffic cue 到 response 之間,每一步都產生一個具體 file、view 或 scene layer。
Source layer 放在迴路前面:geographic boundary、route network、traffic demand、incident definition 和 synthetic-data limits。之後 workflow 才進入 observed traffic state、event metadata、simple signal-response comparison 和 exported response artifacts。
- Input. OSM boundary、SUMO routes、incident JSON。
- Artifact. source registry 與 scope notes。
- Purpose. 先界定哪些 data 進入場景。
- Input. traffic state、actor positions、phase labels。
- Artifact. exported JSON、frames、sensor captures。
- Purpose. 讓場景狀態可以 replay。
- Input. event time、severity、affected zone。
- Artifact. incident card 與 OpenUSD scene layers。
- Purpose. 把視覺事件變成可查的狀態。
- Input. fixed timing 與 queue-aware baseline。
- Artifact. KPI table、delay / throughput tradeoff。
- Purpose. 讓回應選擇有可檢查理由。
- Input. chosen response 與 action layer。
- Artifact. report、OpenUSD layer、exported data。
- Purpose. 留下之後可以 audit 的 outputs。
Walkthrough:從 source 到 response 的 material
1. 把 scene 錨定到真實地點
基礎場景從可重現的地理邊界開始,經過 map reference、satellite alignment、generated mesh,到 OpenUSD scene assembly。這一步先讓 digital twin 的空間來源可見,再進入事故與回應層。
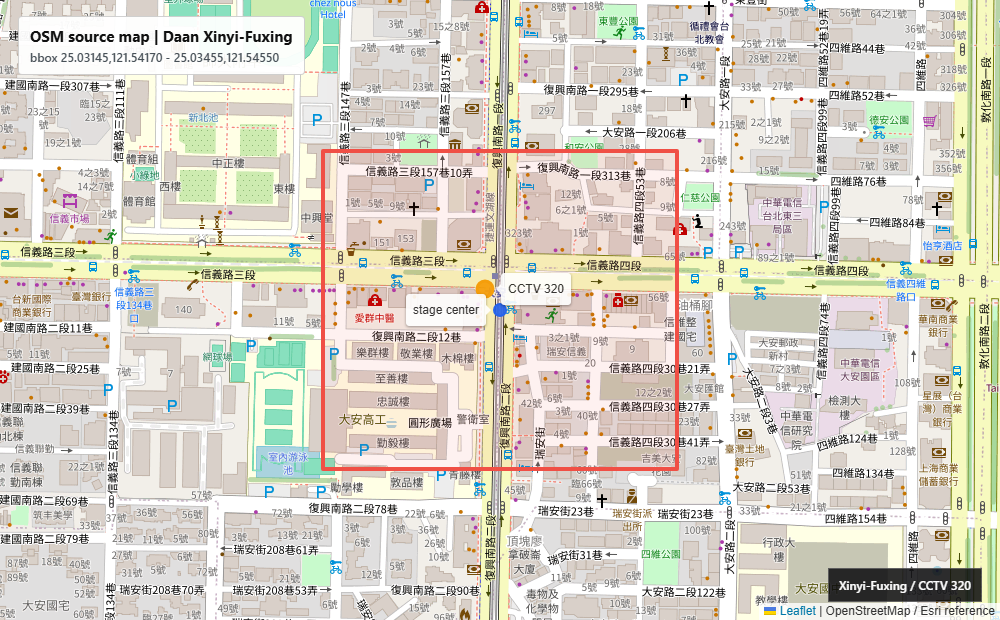
資料邊界。 OpenStreetMap / Overpass 定義大安路口研究區域。
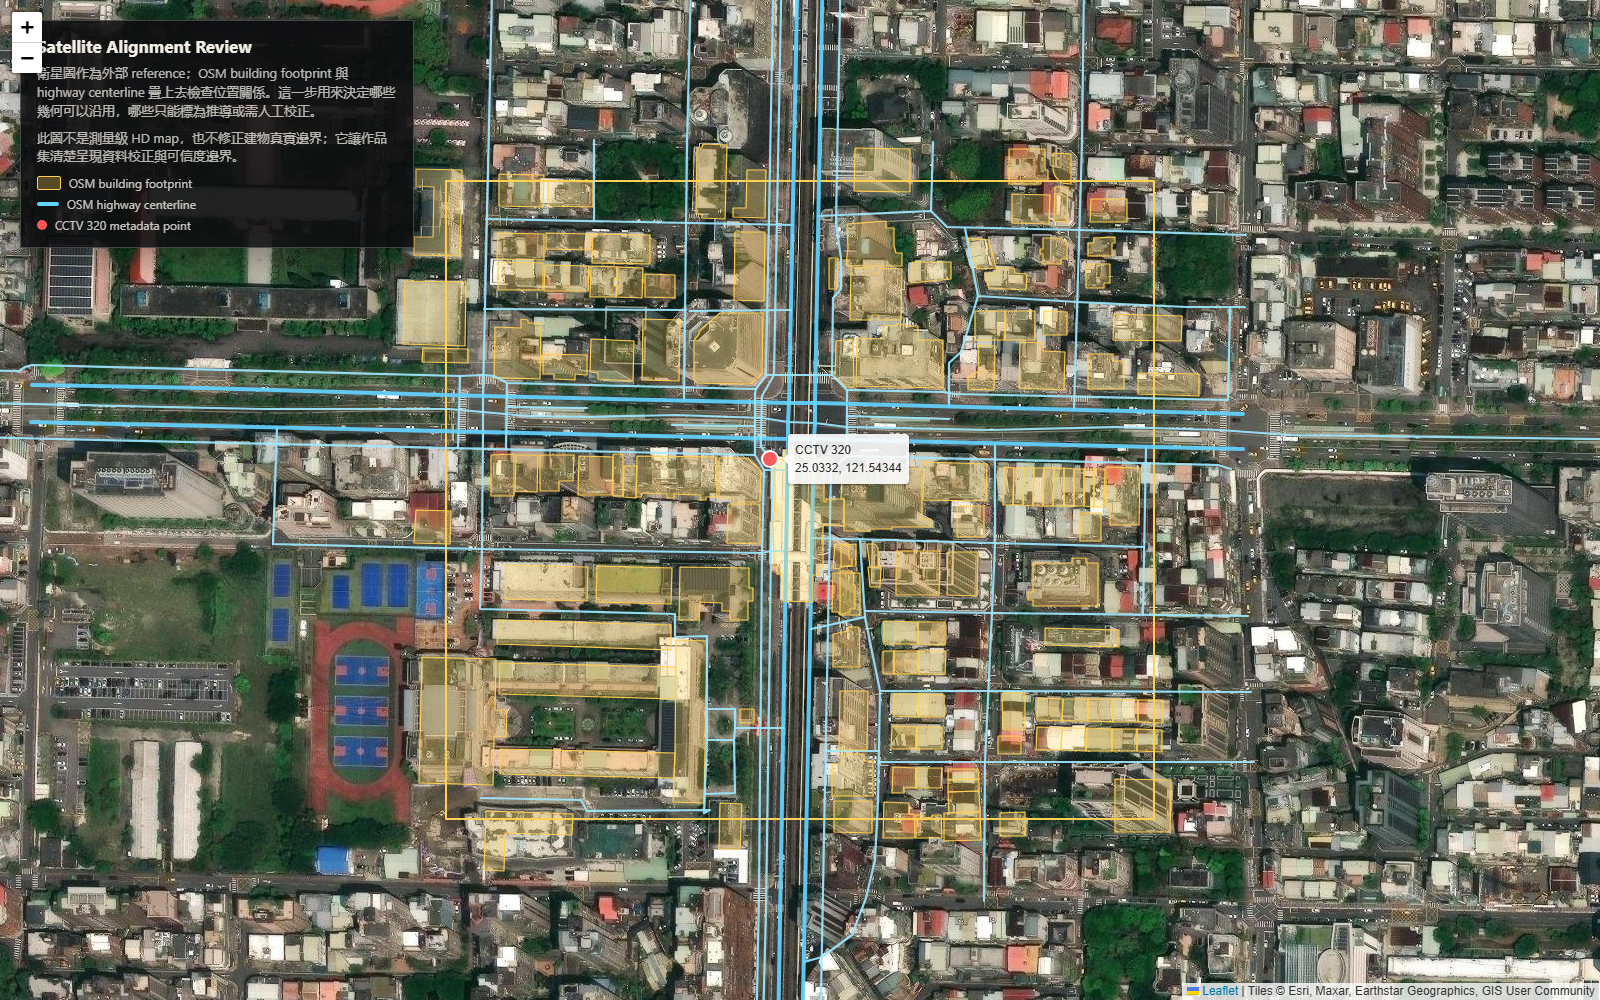
對齊檢查。 用衛星參考圖檢查 OSM 衍生道路模型與真實城市脈絡的位置關係。

Mesh 生成。 改用 vector redraw,讓 OSM2World road mesh、building footprints 與 study boundary 在作品集尺寸下仍然清楚。

場景組裝。 將低解析度俯視截圖改成可讀的 layer diagram,顯示 geometry、traffic、incident、sensor 與 action layers 如何被組成。

Omniverse 檢視。 在 simulation / OpenUSD 環境中檢查場景。
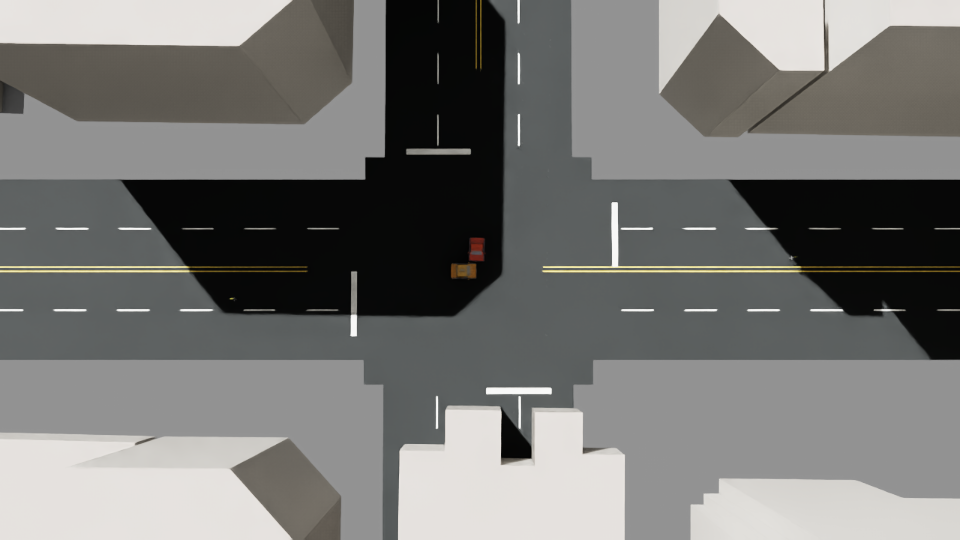
乾淨場景層。 不含事件 overlay 的基礎環境視覺檢查。
Implementation note: Anchoring OpenStreetMap to OpenUSD, the coordinate transform you can actually run twice.
2. 事故前後的 traffic
下一層是時間。Traffic motion、phase labels 和可 replay 的 incident outputs,讓基礎模型變成可以逐格檢查的情境。
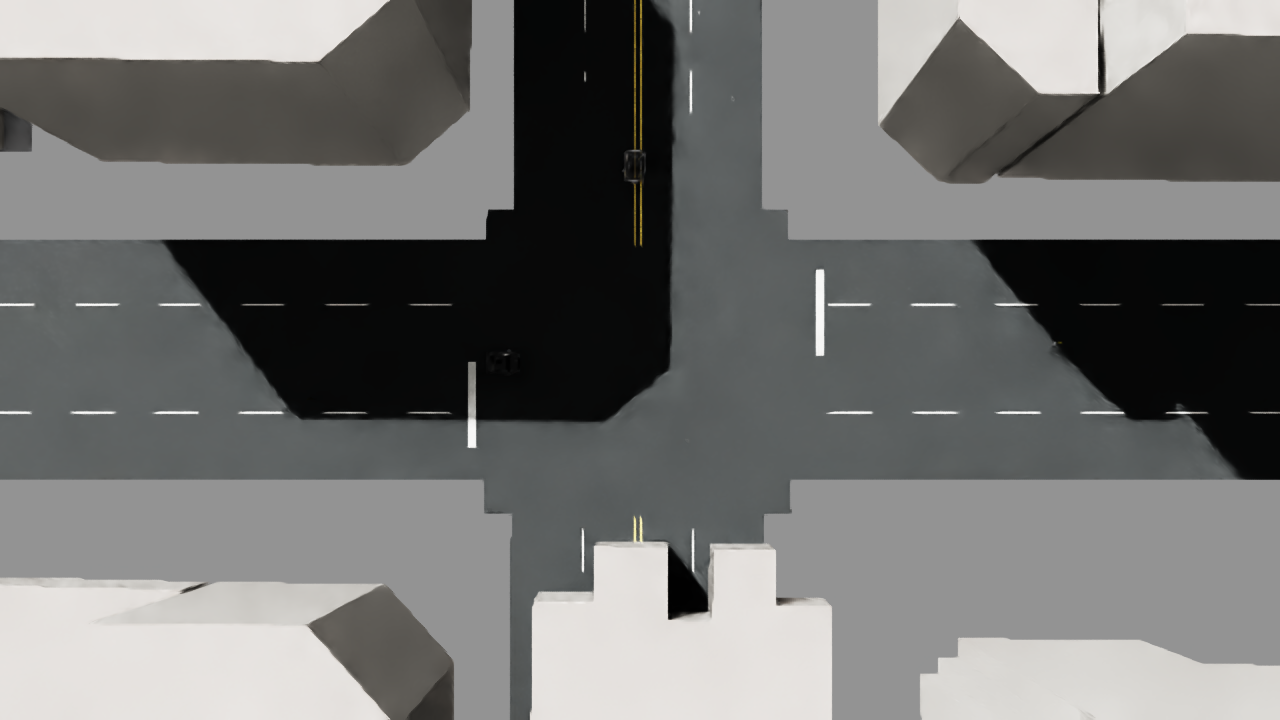
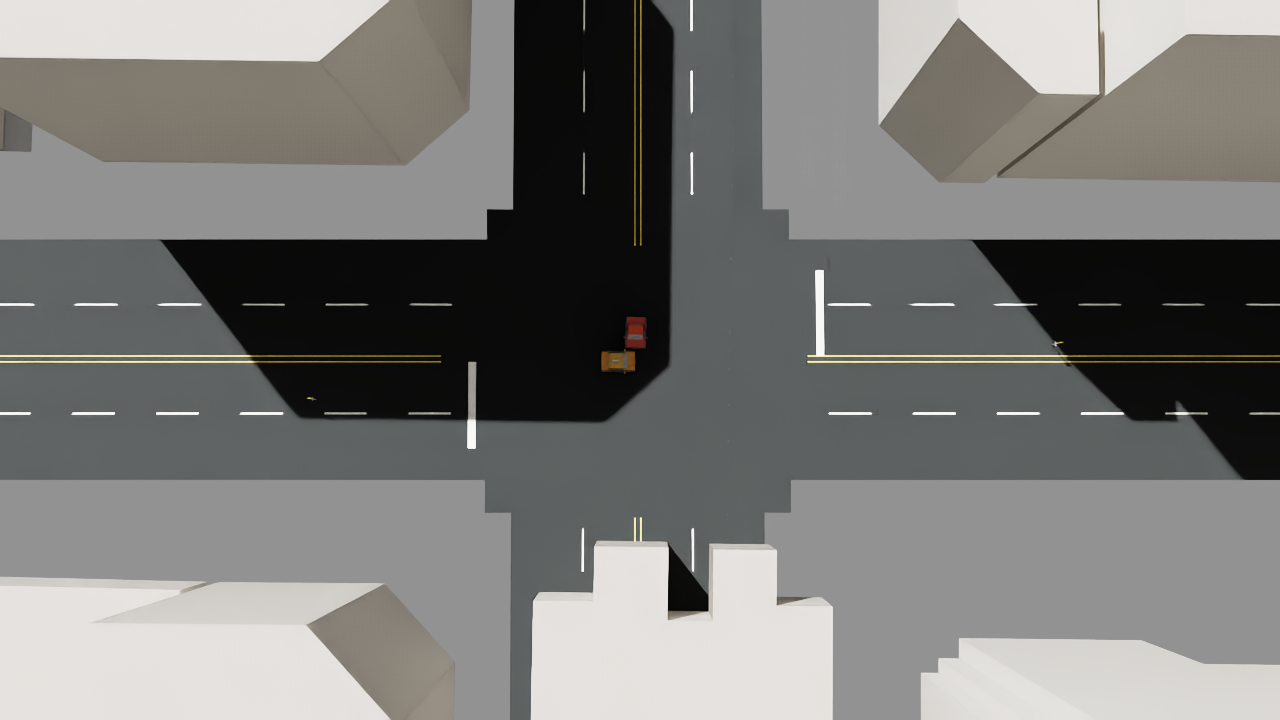
SUMO 交通重播。 合成 FCD traffic state 驅動 scenario timeline。
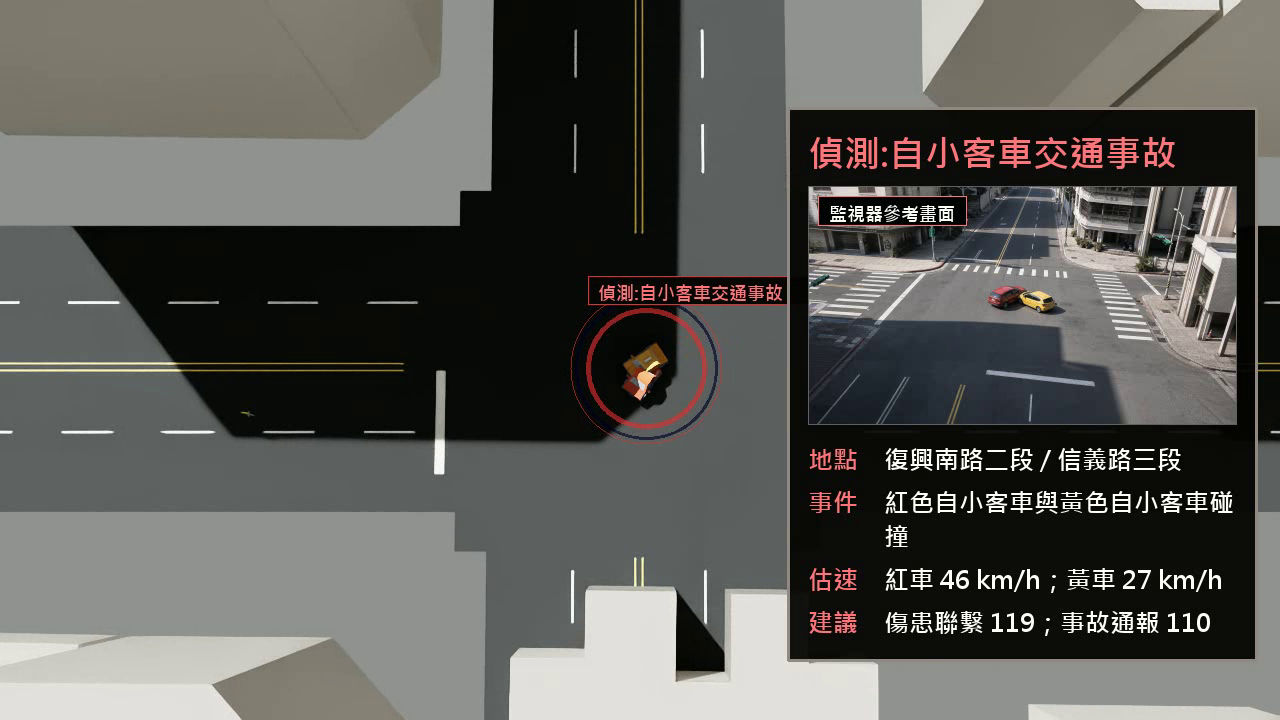
事故重播。 合成 CCTV-style 事故輸出與事件 metadata 對齊。


3. 場景裡的 event state
Incident 被整理成 structured metadata:phase、event time、source、severity、affected zone 和 response status。這些欄位讓 visual scene 可以被 response workflow 引用。

操作端 event card。 事件 metadata 被整理成 render 旁邊可閱讀的 incident state。

階段時間軸。 視覺情境與命名的事件階段、時間戳綁定。
4. 路口感測器視角的 outputs
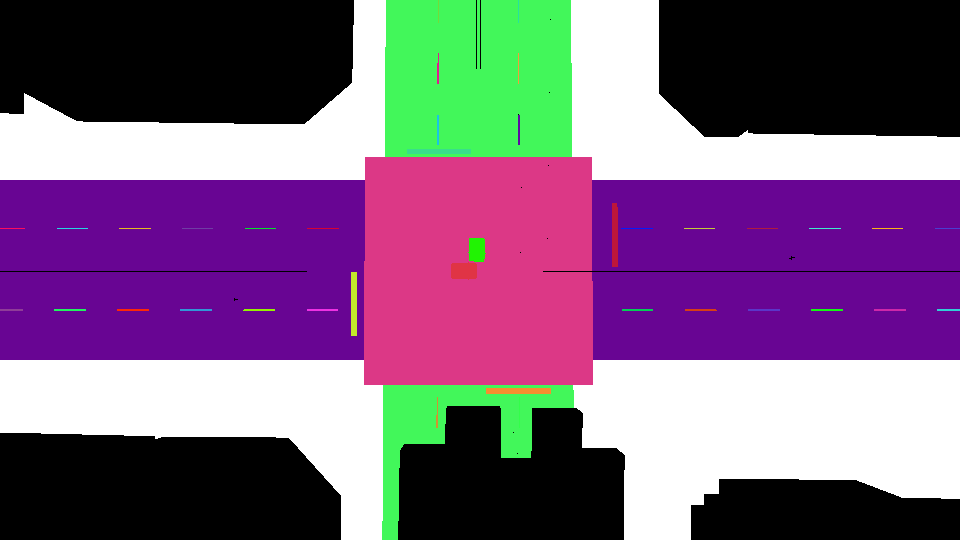
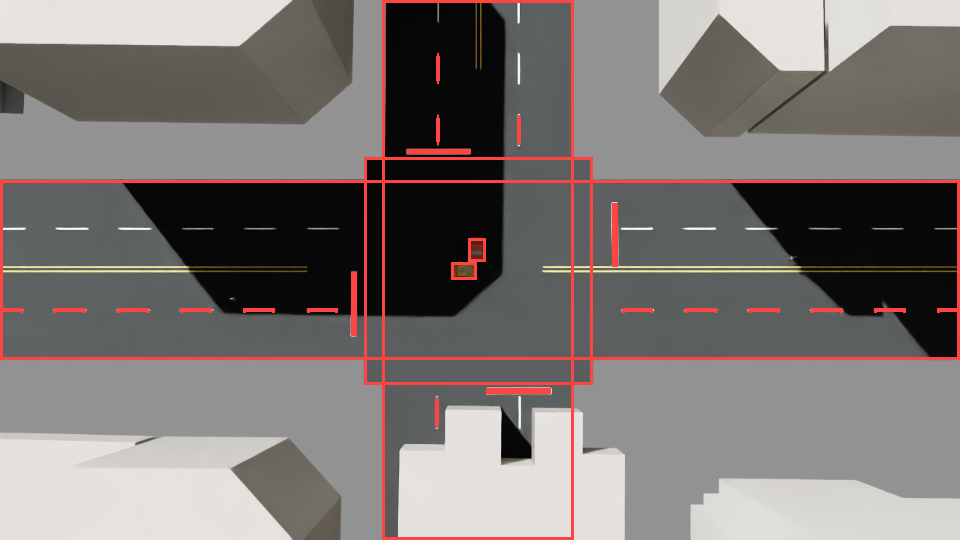
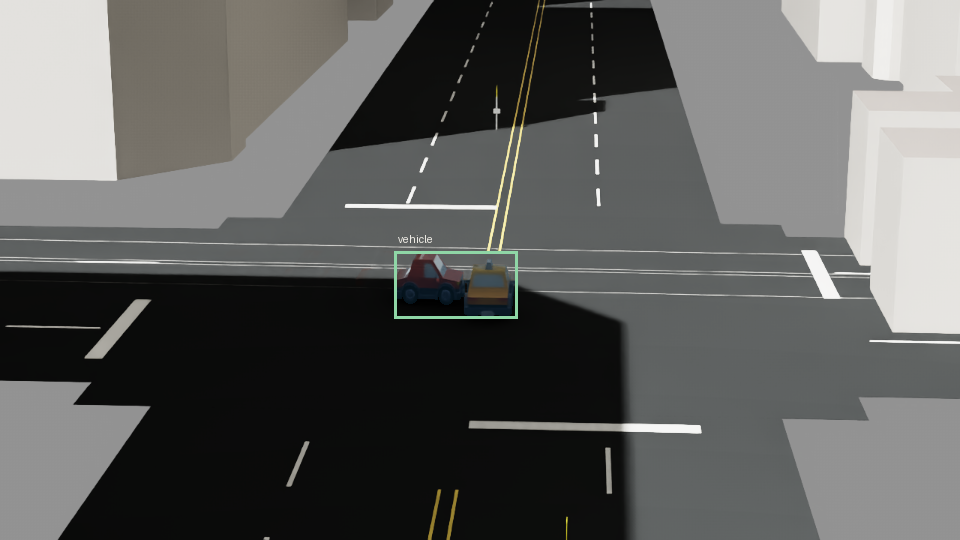
Omniverse 在這裡同時負責場景視覺化與 generated sensor views。同一個 incident frame 可以輸出對齊的 RGB、depth、semantic masks、instance masks、bounding boxes 與 derived detection targets。高密度 dataset preview 被收進可展開區塊,讓主頁維持在 incident-response walkthrough 上。
開啟 sensor-output images
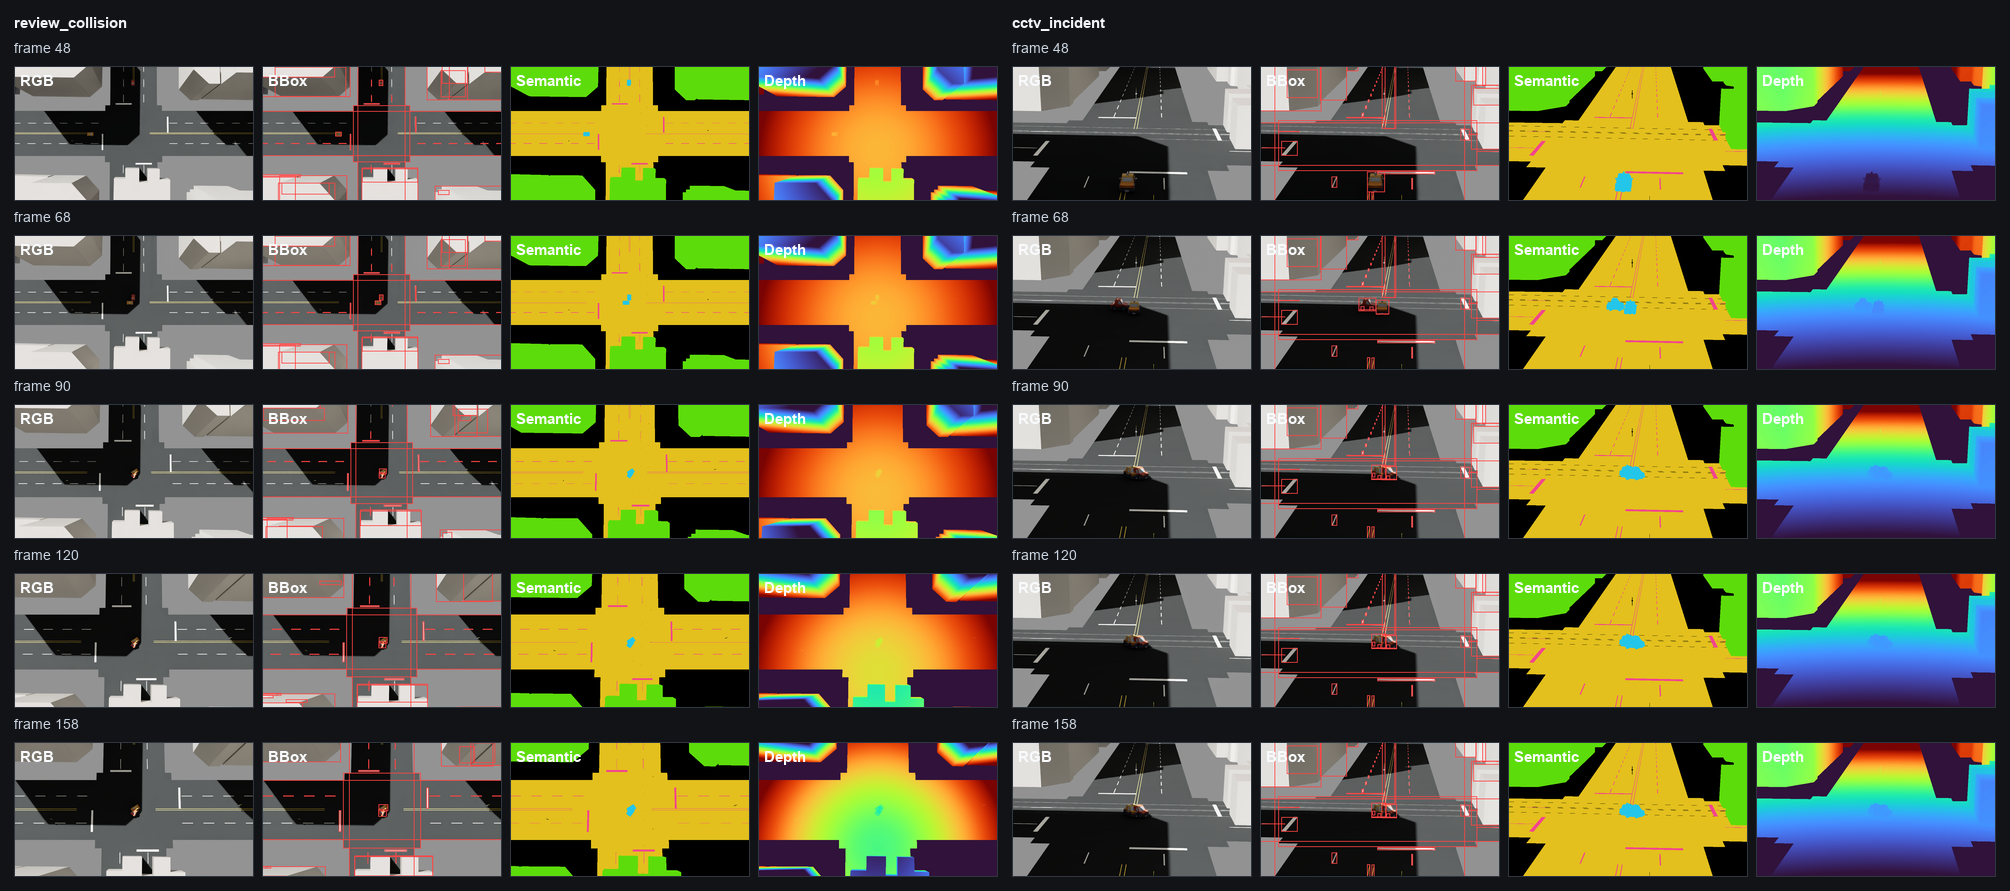
合成感測器 contact sheet。 一個事故情境被匯出成多個對齊的 training / validation channels。


單次 generated run: 222 筆 incident-event samples,111 frames 乘以 2 cameras,2,220 個 ground-truth files checked,259 個由 semantic masks 產生的 vehicle instances,且每一 frame 都帶有 event layer 的 phase label。
5. 回應選擇與留下的 outputs
Signal-response layer 刻意維持簡單:fixed timing vs queue-aware baseline。Queue-aware version 在這個 scenario 裡降低 delay,但 throughput 仍然有 tradeoff。這個結果已經足夠讓 response choice 被討論,不需要把頁面擴張成完整 traffic-control optimization project。
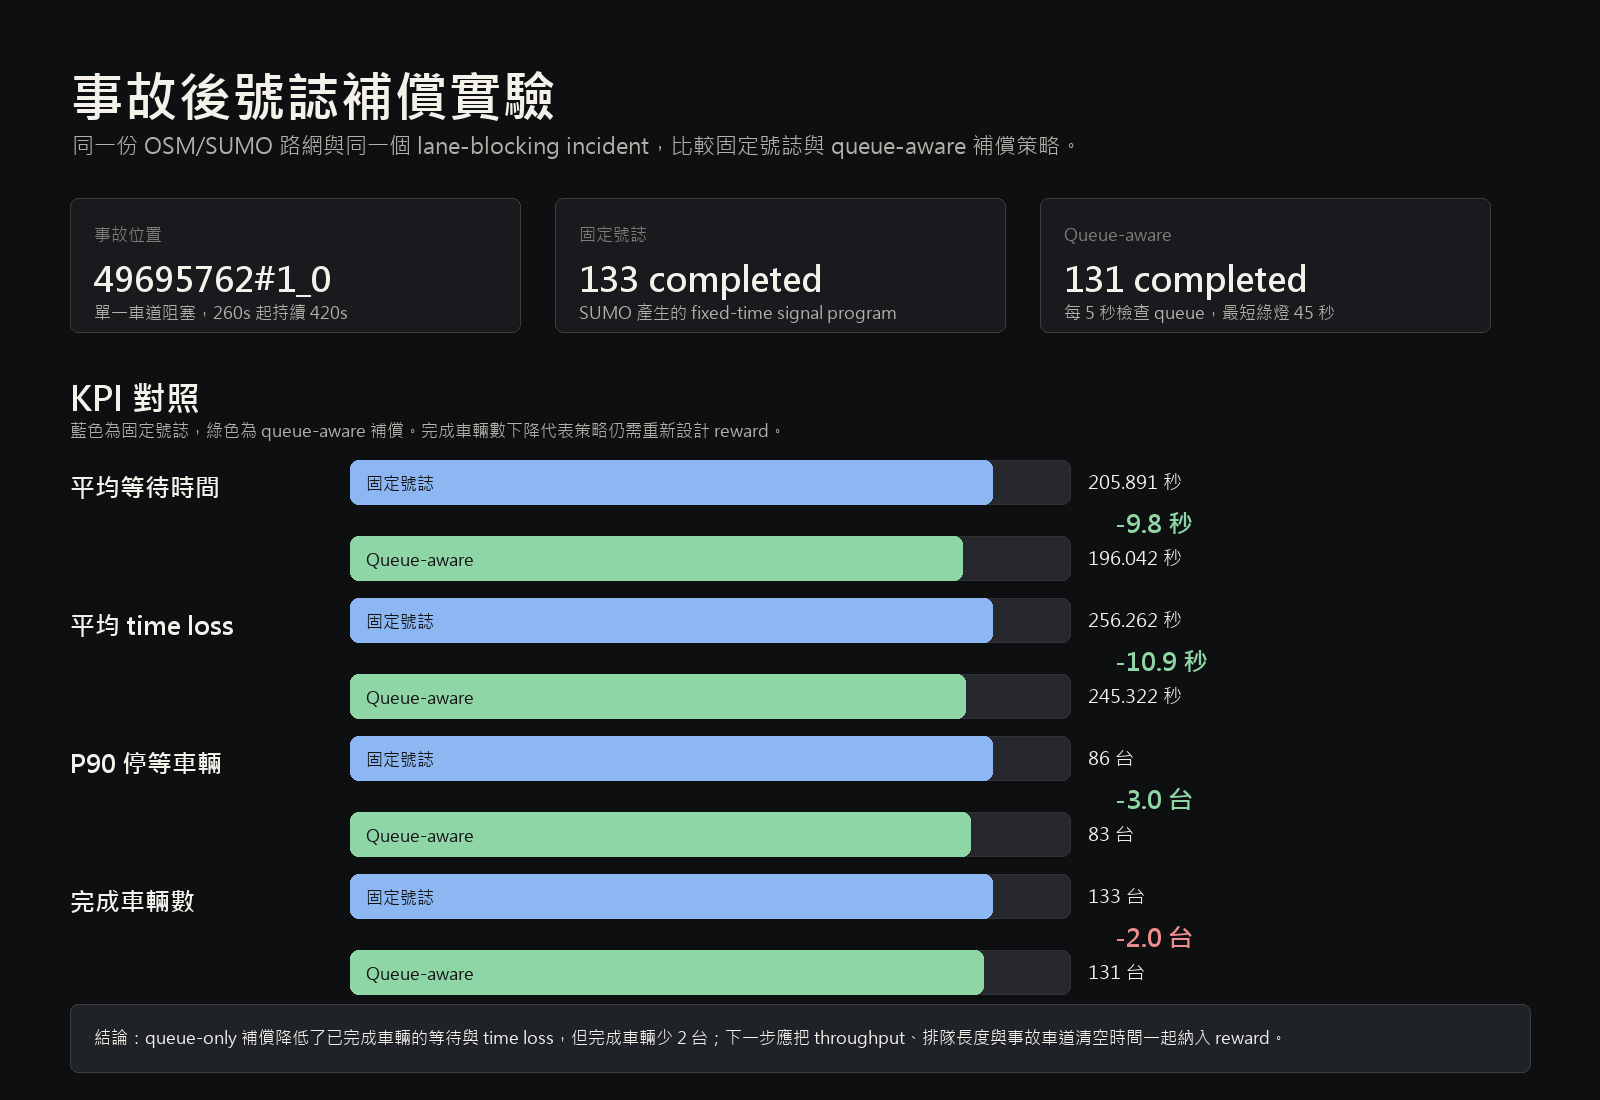
Response comparison. Queue-aware control 在這次 run 裡降低了 delay metrics,但沒有全面勝過 throughput。
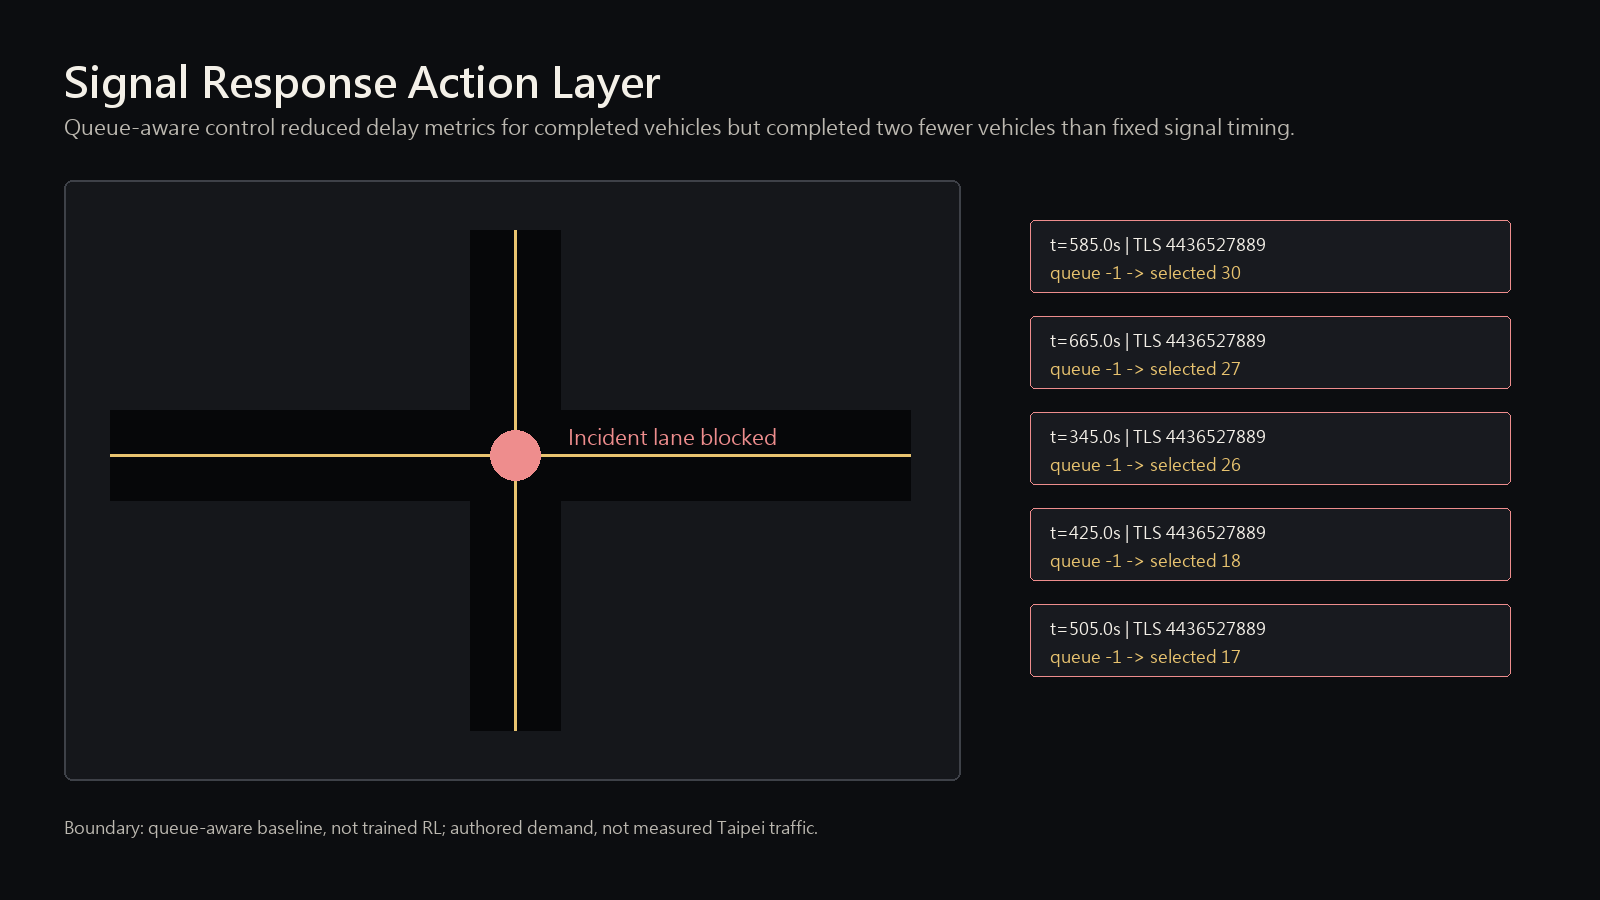
回應層。 號誌反應以可檢查資料表示,和 rendered scene 並排閱讀。
Scope
目前 prototype 覆蓋的是可檢查 workflow:source-data pipeline、scene layers、generated sensor outputs 和 response artifacts。Live-city deployment、real CCTV integration、RL policy training 屬於下一階段。
- OSM / SUMO source-data pipeline
- OpenUSD source、observe、action layers
- Google 3D preview prototype
- validation reports 與匯出的 JSON artifacts
- synthetic sensor-output generation and checks
- traffic actors 由 SUMO 產生
- incident outputs 是合成資料
- CCTV-style views 是 generated simulator outputs
- 號誌 response 是 transparent baseline comparison
- reinforcement-learning policy training 是下一階段延伸
方向
這個專案把我的 spatial-design 背景接到我接下來想持續發展的工程方向:建立 digital twin 與 real-time 3D systems,讓 physical context、simulation state 和 operational outputs 能夠被檢查、replay 與改善。
在 industrial digital twin 的脈絡下,這個 smart-city case 可以搭配另一個更偏 CAD-to-SimReady warehouse composition 的 companion project:Smart Warehouse CAD-to-SimReady Digital Twin。
Artifacts
這些是頁面背後的產出 artifacts: